Sales Managers: Prove Coaching ROI in 60 Days with Two Leading Metrics
Track the right sales coaching metrics: skill progression, behavior adoption, conversation quality, and prove coaching ROI in 30–90 days.
Published: September 10, 2026
Author: OffBook Editorial Team

Track four leading indicators (skill progression velocity, behavior adoption rate, conversation quality score, coaching adherence rate) alongside one lagging outcome like win rate or quota attainment. Pick two leading metrics and one lagging metric, set a 30-day baseline, and schedule weekly quick-checks starting now. Structured coaching programs correlate with measurably higher quota attainment, but only when someone actually tracks the leading signals that predict it.
TL;DR:
- Tracking coaching adherence and skill progression velocity weekly helps identify issues early before they impact win rates or quota achievement.
- Focusing on two leading metrics, such as behavior adoption rate and skill progression velocity, provides more actionable insights than activity counts alone.
- Setting a baseline with at least eight to ten scored calls per rep over 30 days is essential to trust trend accuracy before making coaching decisions.
- Using automated call scoring and real-time prompts during calls improves coaching adherence and accelerates behavior adoption, shortening feedback loops.
- Limiting dashboards to five key widgets, including skill velocity and win-rate delta, makes performance tracking both effective and manageable.
Table of Contents
- The Five Categories of Sales Coaching Metrics
- How to Choose Metrics and Set Baselines Before Coaching Begins
- Tracking the Numbers: CRMs, Call Scoring, and Cadence
- Proving ROI: A Worked Cohort Example
- Building a Coaching Dashboard You’ll Actually Use
- Where Real-Time Coaching Changes the Measurement Game
- What the Data Actually Tells You to Prioritize
- Put These Metrics on Autopilot With Offbook
- Sources
The Five Categories of Sales Coaching Metrics
Most sales managers default to activity counts because they’re easy to pull from a CRM. Calls made, emails sent, meetings booked. None of that tells you whether coaching is working. It tells you whether reps are busy.
Real coaching measurement splits into five categories, and mixing them up is the single most common mistake managers make.
Reach and cadence covers how often coaching actually happens. Coaching sessions per rep per month is the base metric here: count completed 1:1 coaching sessions divided by scheduled sessions to get your adherence rate. If a manager schedules four sessions and completes three, that’s a 75% adherence rate. This is a leading indicator, and it should be reviewed weekly, because a manager who skips coaching for three weeks straight is a problem you want to catch fast, not at quarter’s end.
Quality and engagement measures what happens inside the coaching conversation, not whether it happened. A conversation quality score, usually built from a rubric scoring discovery depth, objection handling, and next-step clarity on a 1 to 5 scale, tells you whether the coaching itself is any good. Average those scores across a rep’s calls monthly and you get a trend line worth watching.
Skill adoption and progress is where the real predictive power lives. Skill progression velocity measures how fast a rep’s rubric score improves over time: take the score change divided by the number of coaching cycles. A rep improving their discovery score across coaching cycles demonstrates skill progression velocity. Behavior adoption rate measures how many coached behaviors a rep uses subsequently; for example, if a rep uses some of the coached behaviors on the next call, that indicates adoption, expressed as a percentage. Review both monthly, once you have enough calls per rep to trust the number.
Performance impact is your lagging outcome check. Win rate (deals won divided by total qualified opportunities) and quota attainment (revenue closed divided by quota target) confirm whether the leading indicators are translating into results. Gartner’s methodology deployment framework recommends tracking stage conversion alongside adoption, since a rep can adopt a behavior without yet converting more pipeline.
Operational efficiency rounds it out with metrics like ramp time (days from hire to first closed deal) and coaching hours per rep. These matter for resourcing decisions, not weekly coaching feedback, so a quarterly review cadence fits.
- Coaching adherence rate: sessions completed / sessions scheduled, weekly review
- Conversation quality score: rubric average across recent calls, monthly review
- Skill progression velocity: score delta / coaching cycles, monthly review
- Behavior adoption rate: behaviors demonstrated / behaviors coached, monthly review
- Win rate and quota attainment: outcomes divided by qualified pipeline or target, quarterly review
Small sample sizes distort every one of these. A rep with four calls in a month can swing from a 3.0 to a 4.5 quality score on noise alone, so treat anything under eight to ten scored calls per rep per month as directional, not conclusive.
How to Choose Metrics and Set Baselines Before Coaching Begins
There’s no single metric that proves coaching works. The fix is mapping metrics to the specific skill you’re coaching, not picking whatever the dashboard already shows.
- Name the coaching objective first: shorter sales cycles, better discovery, cleaner qualification against a framework like MEDDIC.
- Map that objective to one or two leading metrics (skill progression velocity for a specific rubric item, behavior adoption for a defined technique) and one lagging metric that would confirm impact.
- Set a baseline across a 30-day window before you change anything, using a coached cohort and, where team size allows, an uncoached control group for comparison.
- Require a minimum of eight to ten scored calls per rep in the baseline window before you trust any trend.
Pro Tip: Resist the urge to track more than three metrics per coaching initiative. Every additional KPI dilutes manager attention and makes it harder to tell which lever actually moved the outcome.
The most common pitfall is attribution. If three things changed at once (new pitch deck, pricing update, and coaching push), you can’t credit the coaching for a win-rate bump. Isolate variables where you can, and use the personalized baseline approach OffBook outlines for rep performance tracking as a starting framework.
Tracking the Numbers: CRMs, Call Scoring, and Cadence
Four data sources feed a real coaching measurement system, and each one covers a gap the others miss.
- CRM data gives you pipeline movement, deal stage, and win/loss outcomes tied to each rep.
- Conversation intelligence captures what actually happened on the call: talk ratio, objection handling, question quality.
- QA rubrics turn subjective call review into a consistent, comparable score across reps and managers.
- Rep self-assessments flag confidence gaps that scored calls alone won’t surface.
HubSpot’s guidance on leading and lagging indicators points at the core issue: without automation, someone has to manually score every call, and that doesn’t scale past a handful of reps. A consistent rubric applied by a human or an automated scoring layer is what makes skill progression velocity and behavior adoption rate trustworthy instead of anecdotal.
Cadence matters as much as the metric itself. Run manager quick-checks weekly on adherence and quality scores, cohort reviews monthly on skill velocity and adoption, and leadership ROI reporting quarterly. The recommended coaching cadence framework for sales managers follows roughly the same rhythm.
Proving ROI: A Worked Cohort Example
The ROI formula is straightforward: (value generated from coaching minus coaching cost) divided by coaching cost, expressed as a percentage.
Here’s a worked example. Say a 10-rep team runs a 60-day coaching push targeting discovery quality. A win-rate lift of this size, applied against an average deal size of $18,000 and 40 qualified opportunities per month, adds roughly two incremental closed deals a month, or $36,000 in new monthly revenue.
Use an attribution window of about 30 to 90 days to evaluate impact. Smaller teams may find small changes in win rate inconclusive due to limited data, so larger samples improve confidence before scaling coaching programs.
Building a Coaching Dashboard You’ll Actually Use
A useful dashboard has five widgets, not fifteen. Skill progression velocity as a monthly trend line. Behavior adoption rate as a percentage bar per rep. Coaching cadence compliance as a weekly completion rate. Win-rate delta comparing coached versus baseline. Pipeline value added per coached rep, tracked monthly.
- Skill progression velocity: (current score − baseline score) / coaching cycles, line chart, monthly
- Behavior adoption rate: behaviors demonstrated / behaviors coached, bar chart, monthly
- Coaching cadence compliance: sessions completed / sessions scheduled, weekly
- Win-rate delta: coached win rate − baseline win rate, quarterly trend
Skill progression velocity above 15% month over month is a reasonable benchmark for a coaching push that’s working, based on the kind of velocity and adoption tracking Closer Mode’s research on coaching metrics recommends watching. Below that, the coaching plan probably needs a rework before you scale it to more reps.
Where Real-Time Coaching Changes the Measurement Game
Post-call feedback measures what a rep remembers doing, days after the call ended. Real-time cues let a manager see coaching adherence and behavior adoption inside the conversation itself, which shortens the gap between coaching and behavior change dramatically.
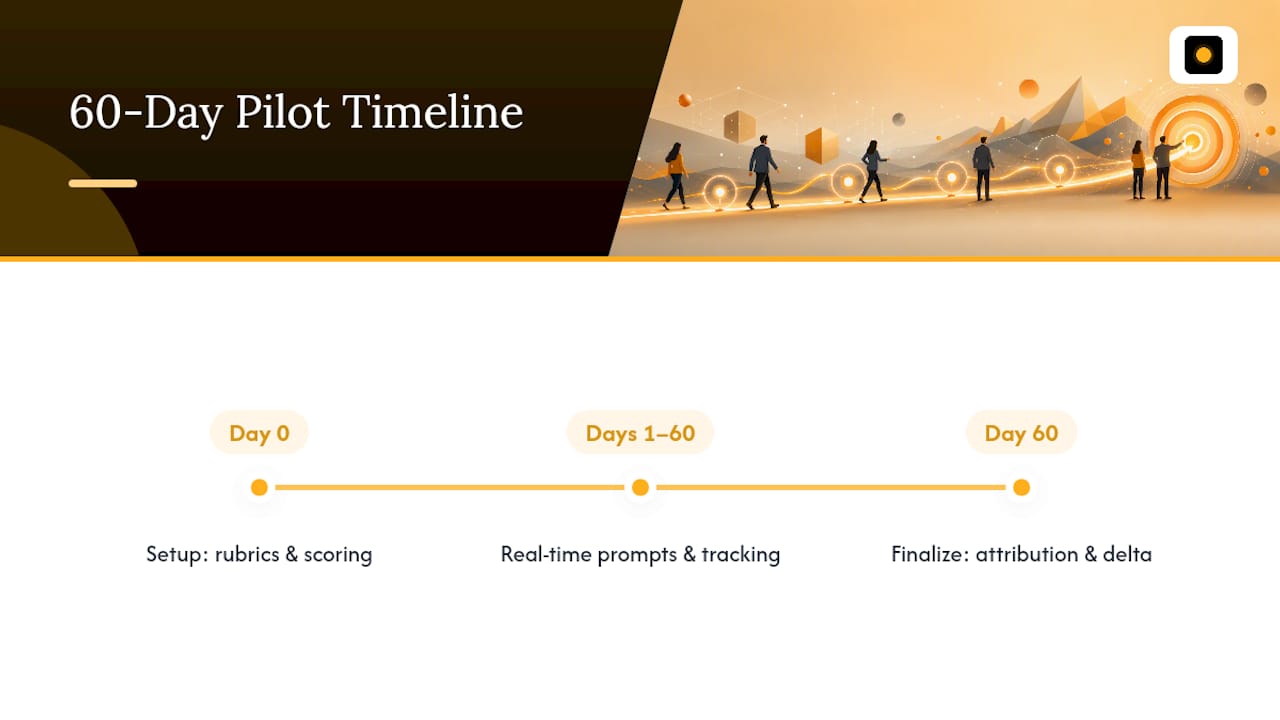
A practical pilot: pick one team, track two metrics (behavior adoption rate and win-rate delta), run it for 60 days. That’s enough time to hit the attribution window discussed above while keeping the test contained. Consistent rubrics and automated scoring are what make skill progression velocity trustworthy at scale, and real-time prompting during the call is what makes adoption happen faster than a Monday debrief ever could.
What the Data Actually Tells You to Prioritize
Most sales organizations still lead with activity dashboards: dials, emails, meetings booked. That’s the conventional advice, and it’s backwards. Activity metrics tell you a rep is working. They tell you nothing about whether coaching changed how well that rep works.
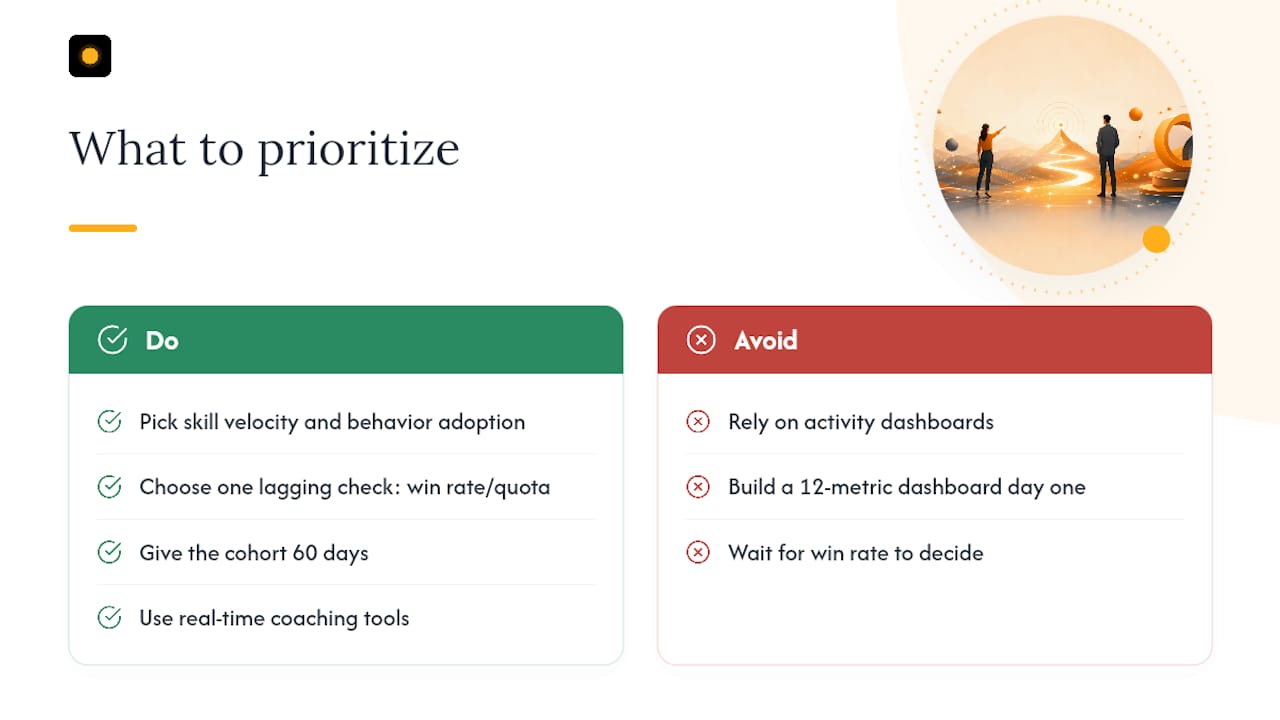
The evidence points somewhere else. Skill progression velocity and behavior adoption rate predict outcome improvement weeks before win rate or quota attainment moves. If you wait for the lagging number to confirm coaching is working, you’ve already burned a quarter you could have used to adjust course. That’s the real cost of measuring coaching the old way: not bad data, but slow data.
What I’d tell any sales manager starting this: don’t build a 12-metric dashboard on day one. Pick your two leading indicators, pick one lagging check, and give the cohort 60 days before you draw conclusions. Real-time coaching tools compress the feedback loop between “we coached this behavior” and “the rep used it,” which is precisely the gap that makes post-call coaching notoriously hard to measure. That compression, not the dashboard itself, is what separates coaching programs that improve quota attainment from ones that just generate meeting notes.
— Neil
Put These Metrics on Autopilot With Offbook
Building the dashboard is one thing. Getting clean, consistent adoption data without a QA team scoring every call by hand is the harder problem, and it’s the one most coaching programs quietly give up on. Some real-time coaching tools listen live during video calls and surface on-screen prompts tied to frameworks like MEDDIC and MEDDPICC, so the behaviors you’re coaching get reinforced in the moment, not three days later in a debrief nobody reads closely.
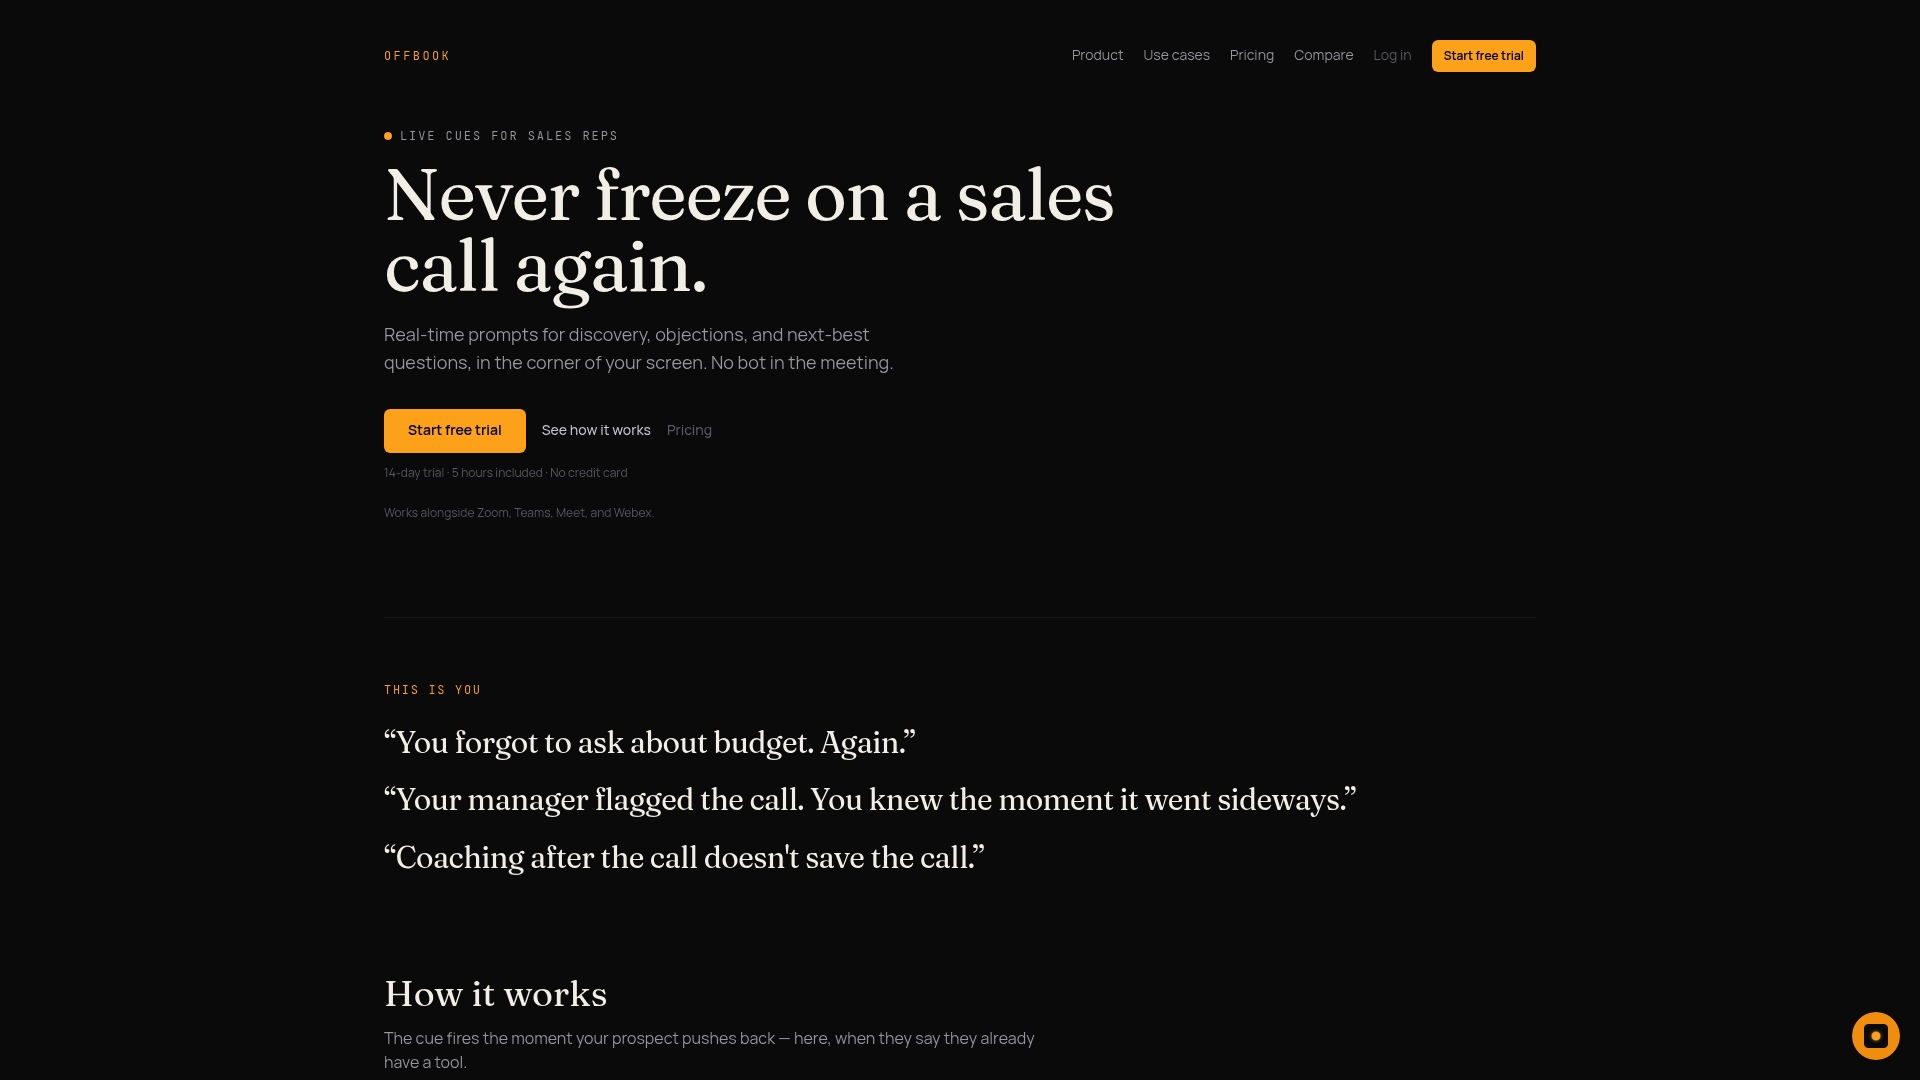
That real-time layer is what makes coaching adherence rate and behavior adoption rate measurable without guesswork. Some software generates a structured debrief automatically after every call, which can help skill progression velocity tracking without depending only on a manager finding time to review recordings. For some B2B SaaS teams running the kind of 60-day pilot described above, that can be the difference between a coaching metric checked quarterly and one acted on weekly.
See how it fits your team on the sales use case page, or dig into the scoring and pre-call brief features on the product page before you start your trial.
Sources
- How to measure sales coaching effectiveness — Sales Enablement Collective
- Sales coaching and value creation — Harvard Business School (RIS)
- 6 essential steps to deploy your sales methodology — Gartner
- Sales metrics — HubSpot Blog