What Is a Sales Scorecard? A B2B SaaS Guide
Discover what a sales scorecard is and how it helps B2B SaaS teams identify performance gaps early, boosting coaching effectiveness.
Published: July 27, 2026
Author: OffBook Editorial Team

A sales scorecard is a rep-level coaching tool that converts activity and outcome metrics into a single, actionable score so managers can spot performance gaps before they become quota misses.
TL;DR:
- A scorecard tracks both leading indicators (meetings booked, account engagement) and lagging indicators (win rate, quota attainment) in one view
- Gartner recommends organizing metrics into tiers and validating them with hypothesis testing and regression analysis
- Offbook complements scorecards by delivering live AI cues during calls, closing the loop between what the data flags and what actually changes on the next call
- The primary business value: catch coaching opportunities early, before a rep’s pipeline dries up
Table of Contents
- Why do B2B SaaS teams use a sales scorecard?
- Which metrics should you include on a scorecard?
- How do you design a scorecard that actually works?
- How do you turn scorecard data into coaching and real-time cues?
- What does a practical implementation look like?
- A sample scorecard template you can copy today
- How do you know if the scorecard is actually working?
- What mistakes kill scorecard adoption?
- What about privacy and data governance?
- How do you train managers to use scorecards well?
- Key Takeaways
- Scorecards are a starting point, not a finish line
- Offbook turns scorecard insights into real-time call coaching
- Useful sources
Why do B2B SaaS teams use a sales scorecard?
A scorecard gives managers something a CRM dashboard rarely does: a rep-specific signal that something is drifting before it shows up in closed revenue. That early warning is the whole point.
When a rep’s account engagement score drops two weeks in a row, a manager can schedule a targeted 1:1 now, not after the quarter closes short. That shift from reactive to proactive is what separates teams that consistently hit quota from those that scramble at month-end.
The practical benefits stack up quickly:
- Faster 1:1 diagnostics: One glance at a scorecard tells a manager which metric to probe, cutting prep time for coaching conversations
- Clearer manager actions: A flagged metric maps directly to a coaching intervention, not a vague “do better” conversation
- Forecasting signal: Leading indicators on a scorecard give revenue ops an earlier read on pipeline health than lagging metrics alone
- Improved call quality: When reps know their call-quality score is tracked, preparation and discovery discipline improve
Gartner’s tiered framework organizes metrics into three layers: a productivity definition, lagging indicators, and leading indicators. That structure prevents the common mistake of treating all metrics as equally important.
Sales rep accountability becomes concrete when every rep can see exactly which behaviors drive their score, not just their rank on a leaderboard.
Which metrics should you include on a scorecard?

The leading vs. lagging distinction is the most important design decision you will make. Leading indicators predict future outcomes; lagging indicators confirm what already happened. You need both, but the ratio matters.
Pipeline/ZoomInfo recommends keeping the total metric count tight: 2–5 leading indicators and 2–5 lagging indicators. More than that and the scorecard stops telling a story and starts hiding one.
Leading indicators (predictive):
- Meetings booked per week
- Account reach (number of contacts engaged per account)
- Account engagement (response rate, multi-thread depth)
- Average interaction value (AIV): quality-weighted measure of each touchpoint
- Response time to inbound leads
Lagging indicators (confirmatory):
- Win rate
- Quota attainment
- Average deal size
- Sales cycle length
- Pipeline coverage ratio
Metric selection shifts by role. An SDR scorecard leans heavily on leading indicators because their job is top-of-funnel generation. An AE scorecard weights lagging indicators more, since AEs own the close. A CSM renewal scorecard centers on retention metrics like net revenue retention and expansion rate.
Pro Tip: Gartner flags average interaction value (AIV) as a stronger predictor than raw call volume. If you can only add one non-obvious metric, make it AIV — it captures whether reps are having quality conversations, not just frequent ones.
How do you design a scorecard that actually works?
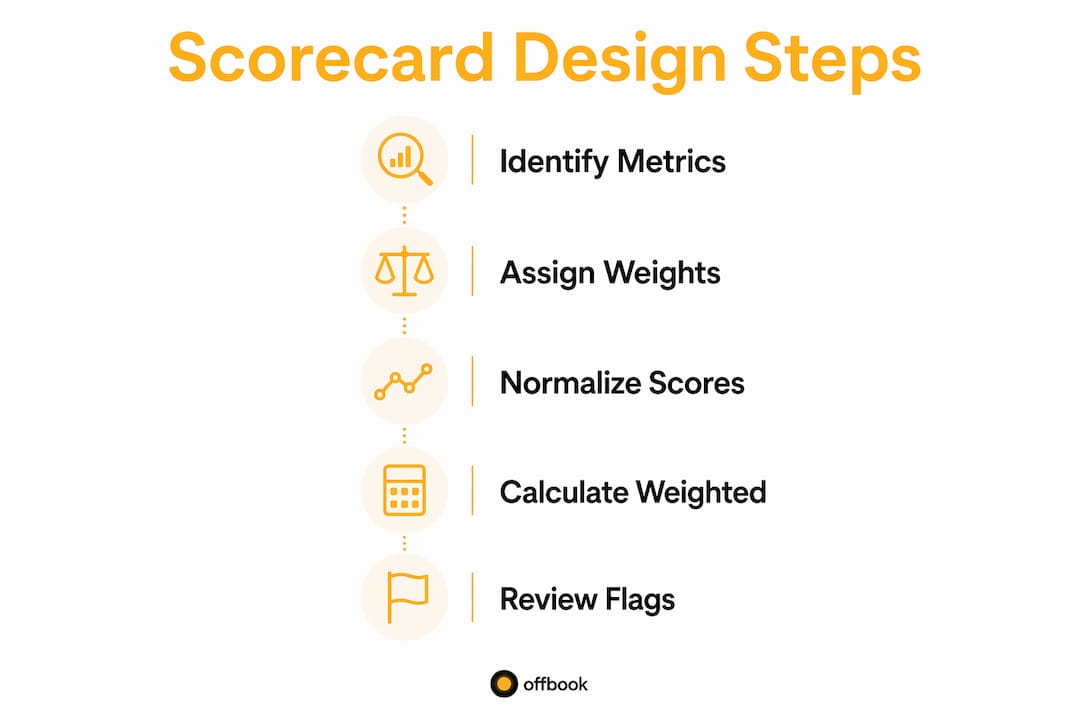
Start with the tiered structure Gartner recommends: define productivity first, then layer in lagging indicators, then leading indicators. That order forces you to agree on what “good” looks like before you start assigning weights.
Step-by-step build:
- Define productivity for each role. What does a fully ramped SDR or AE produce in a normal week? That baseline is your tier-one anchor.
- Select 2–3 lagging indicators that directly reflect revenue outcomes for that role.
- Select 2–3 leading indicators that your hypothesis says predict those outcomes.
- Assign weights. Equal weights work for a first iteration. Once you have data, shift weight toward metrics that show the strongest correlation with outcomes.
- Set thresholds. Define green/yellow/red bands for each metric. Yellow triggers a coaching conversation; red triggers an escalation.
- Normalize scores. Convert raw numbers to a 0–100 scale so a “meetings booked” score and a “win rate” score are comparable.
A simple worked example for an AE:
| Metric | Weight | Raw Score | Normalized (0–100) | Weighted Score |
|---|---|---|---|---|
| Win rate | 30% | — | — | — |
| Quota attainment | 30% | 72% | 72 | — |
| AIV | 15% | Below threshold | — | — |
A score of 77 with a yellow flag on AIV tells the manager exactly where to focus the next 1:1.
Pro Tip: Build your first scorecard in a spreadsheet, not a platform. Iteration speed matters more than automation in week one. Once the metric set stabilizes, wire it into your CRM.
Validation checklist before going live:
- Each metric has a clear owner and a reliable data source
- Thresholds are set from historical data, not guesswork
- Every metric maps to at least one specific coaching action
- The total metric count is ten or fewer
How do you turn scorecard data into coaching and real-time cues?
Qwilr’s practitioner guidance makes a point worth internalizing: the scorecard is a conversation prompt, not a verdict. Managers who walk into a 1:1 with two or three diagnostic questions tied to a flagged metric get far more from the session than those who just read numbers aloud.
When AIV drops, the coaching question is not “why are your numbers low?” It is “walk me through your last three discovery calls — what questions did you open with?” That specificity is what changes behavior.
Safe gamification tactics that build culture without shaming:
- Keep individual scorecards private; share only aggregate team trends publicly
- Recognize improvement, not just top scores (a rep who moves from 55 to 72 deserves more recognition than a rep who coasts at 80)
- Tie scorecard milestones to non-monetary rewards: public shoutouts, choice of territory, early access to new tools
Scorecards work best in three recurring contexts: weekly 1:1s for metric-level coaching, team meetings for trend spotting, and quarterly reviews for threshold recalibration.
The real-time layer is where Offbook fits. When a rep’s account engagement score is declining, the scorecard tells the manager. But the next call is where the gap either closes or widens. Offbook surfaces live AI cues during that call — prompting the rep to ask a deeper discovery question or handle an objection using MEDDIC qualification logic, right when it matters. That connection between a lagging scorecard signal and an in-call behavior change is something post-call tools cannot replicate.
Pro Tip: Map each scorecard flag to a specific AI cue category in Offbook. A yellow flag on “qualification depth” should trigger MEDDPICC prompts on the next call, not a generic coaching reminder.
What does a practical implementation look like?
Required data sources:
- CRM fields: activity logs, pipeline stages, deal values, close dates
- Call-quality scores (manual or AI-generated)
- Calendar data: meetings booked and completed
- Revenue data: closed-won amounts, quota targets
Realistic timeline for a small B2B SaaS team:
| Week | Milestone |
|---|---|
| 1–2 | Define metrics, assign owners, audit data sources |
| 3–4 | Build v1 scorecard in a spreadsheet; pilot with 1–2 managers |
| 5–6 | Collect feedback, adjust thresholds, fix data gaps |
| — | Expand to full team; schedule recurring review cadence |
Roles and effort:
- Sales ops (primary): metric selection, data wiring, threshold-setting
- Sales manager: pilot testing, coaching workflow design
- Enablement: training materials and manager onboarding
- Engineering: CRM integration (typically 4–8 hours for a basic export)
Pro Tip: Check your B2B sales tech stack before building. If your CRM does not log call outcomes consistently, fix that data hygiene problem first — a scorecard built on incomplete data produces misleading scores.
A sample scorecard template you can copy today
Use these fields as your starting structure. Adapt the KPI rows for each role.
| Field | SDR Example | AE Example |
|---|---|---|
| Role | SDR | Account Executive |
| Period | Weekly | Monthly |
| Meetings booked | 8 (target: 6) | N/A |
| Quota attainment | N/A | 72% |
| AIV score | — | — / 100 |
| Weighted total | — | 77 |
| Flags | None | AIV: yellow |
| Coaching focus | — | Discovery quality |
Export this as a CSV and load it into your CRM as a custom object, or keep it in Google Sheets with a shared manager view. For call-quality scoring fields specifically, Offbook can feed normalized scores directly into this template.
CSM scorecards swap “meetings booked” for “QBRs completed” and “win rate” for “net revenue retention.” The structure stays identical.
How do you know if the scorecard is actually working?
Validation is where most teams skip a step. They build a scorecard, run it for a quarter, and assume correlation. Gartner’s guidance is more rigorous: test hypotheses about which leading indicators predict outcomes, then use regression analysis to confirm.
A practical validation sequence:
- Run the scorecard with a pilot group of 4–6 reps for 8–12 weeks
- Keep a control group using the existing review process
- At the end of the pilot, compare win rates, quota attainment, and average deal size between groups
- Run a simple regression: does a one-point improvement in AIV score correlate with a measurable improvement in win rate?
- If the R-squared value is low, the metric is not predictive — replace it
On validation: do not track a metric just because it is easy to pull from your CRM. Track it because you have a hypothesis that it predicts revenue, then prove or disprove that hypothesis with data.
Pro Tip: Eight weeks is the minimum window for meaningful signal on most B2B SaaS sales cycles. Shorter pilots produce noise, not insight. If your average sales cycle is longer than 60 days, extend the pilot to match.
What mistakes kill scorecard adoption?
The most common failure is complexity. A scorecard that tracks too many KPIs stops telling a story and starts creating confusion about where a rep actually needs help.
Common mistakes:
- Tracking 15+ metrics because “they’re all important”
- Using the scorecard as a public leaderboard instead of a private coaching artifact
- Pulling data from inconsistent CRM fields (garbage in, garbage out)
- Never validating whether the metrics actually predict outcomes
- Treating a low score as a performance-improvement plan trigger rather than a coaching prompt
Do/don’t guidance for managers:
- Do prepare two diagnostic questions before every 1:1 tied to a flagged metric
- Don’t read scores aloud without context — always pair a number with a question
- Do review metric relevance quarterly; a metric that stops moving is probably not the right one
- Don’t change metrics mid-quarter; reps need stability to adjust behavior
Quarterly maintenance checklist:
- Audit data sources for completeness and accuracy
- Review threshold bands against current team performance distribution
- Confirm each metric still maps to a specific coaching action
- Refresh manager training on diagnostic questioning
What about privacy and data governance?
Tracking rep performance data carries real obligations, especially as teams grow and scorecards feed into compensation or performance-improvement decisions.
Keep these principles in place from day one. Store scorecard data in your CRM or a secured data warehouse, not in shared spreadsheets with open permissions. Limit access to the rep’s own score and their direct manager. HR and senior leadership should access aggregate views, not individual rep histories, unless a formal review process requires it.
Be transparent with reps about what is tracked, how scores are calculated, and how data is used. Ambiguity breeds distrust and kills adoption faster than a bad metric set. Document the data retention policy: how long are individual scores stored, and what happens to historical data when a rep leaves?
If your team operates across states with specific employee monitoring laws, consult legal counsel before deploying any automated call-quality scoring. California, for example, has notification requirements for recorded conversations that affect how call data feeds into a scorecard.
How do you train managers to use scorecards well?
A scorecard is only as good as the manager who uses it. The tool surfaces the gap; the manager has to close it through conversation.
Start with a two-hour onboarding session that covers three things: how to read a scorecard, how to prepare diagnostic questions from a flagged metric, and how to run a coaching-first 1:1 rather than an accountability review. Role-play matters here. Have managers practice the “why” question sequence on a sample scorecard before they use it with a real rep.
Build a question bank tied to each metric. If AIV is flagged yellow, the manager pulls from a set of pre-written discovery questions. That bank removes the cognitive load of improvising in the moment and makes coaching more consistent across the team.
Schedule a 30-day check-in after launch to surface what managers find confusing or unhelpful. Scorecard adoption fails most often not because reps resist it, but because managers revert to gut-feel coaching when the tool feels like extra work. Reducing that friction in the first month is the highest-leverage investment you can make.
Key Takeaways
A lean scorecard with 2–5 leading and 2–5 lagging indicators, validated with regression analysis and paired with live AI coaching, gives B2B SaaS teams the earliest possible signal on rep performance gaps.
| Point | Details |
|---|---|
| Keep the metric set lean | Limit to 2–5 leading and 2–5 lagging indicators; more metrics obscure where a rep needs help. |
| Validate before you commit | Run an 8–12 week pilot with a control group and use regression analysis to confirm each metric predicts outcomes. |
| Coach with questions, not verdicts | Prepare two diagnostic questions per flagged metric before every 1:1 to convert data into development. |
| Protect rep data | Store scores in secured systems, limit access by role, and be transparent with reps about what is tracked and why. |
| Offbook closes the loop | Use Offbook’s live AI cues to act on scorecard gaps during the next call, not after the quarter ends. |
Scorecards are a starting point, not a finish line
Most teams treat a scorecard as the end product. Build it, roll it out, review it quarterly. That framing misses the point entirely.
The scorecard is a diagnostic instrument. Its value is not in the score itself but in the conversation the score makes possible. A rep with a yellow flag on AIV does not need a lecture about call quality. They need a manager who walks into the 1:1 having already listened to one of their recent calls and prepared a specific question about how they opened the discovery phase.
What I find underappreciated in most scorecard guides is the time dimension. A single score tells you almost nothing. A trend over four to six weeks tells you whether a rep is improving, plateauing, or drifting. Managers who track trend lines rather than point-in-time scores catch problems earlier and have more credible coaching conversations because they can show a rep the direction of travel, not just where they landed this week.
The other thing most guides skip: scorecards and live coaching are not substitutes for each other. The scorecard tells you what to work on. Live AI coaching, the kind Offbook delivers during an actual call, is how you work on it in the moment when behavior actually changes. That combination, a lean scorecard feeding targeted coaching cues, is what separates teams that improve quarter over quarter from those that just measure quarter over quarter.
Offbook turns scorecard insights into real-time call coaching
Your scorecard tells you which reps need help with discovery, qualification, or objection handling. Offbook delivers that help during the call itself, surfacing live AI cues on-screen without a bot ever joining the meeting.
When a rep’s AIV score flags yellow, the next call is the moment to close that gap. Offbook prompts the right MEDDIC or MEDDPICC questions in real time, so reps ask better questions before the deal stalls, not after the debrief. It also generates pre-call briefs so reps walk into every meeting already knowing the company, the stakeholders, and the likely objections.
Built for seed and Series A B2B SaaS teams, Offbook connects the insight your scorecard surfaces to the behavior change that actually moves the number. See how it works for your sales team.
Useful sources
- Gartner: Use a tiered model to design sales performance metrics — Primary source for the tiered framework (productivity, lagging, leading) and the recommendation to validate metrics with hypothesis testing and regression analysis. Consult this first for technical validation methodology.
- Pipeline/ZoomInfo: What Is a Sales Scorecard? — Practical guidance on keeping scorecards lean (2–5 leading, 2–5 lagging), treating them as private coaching tools, and avoiding KPI overload. Best for template design and common mistakes.
- Qwilr: Sales Scorecard: How to Measure and Coach Your Reps — Covers diagnostic coaching techniques, gamification best practices, and how to use scorecards as conversation prompts rather than accountability tools.
- Mindtickle: Sales Scorecards Explained — Explains how blending activity and results metrics creates a 360-degree rep view and surfaces training needs.
- Bigtincan: What is a Sales Rep Scorecard? — Details the three core use cases: 1:1 coaching, weekly team meetings, and monthly/quarterly reviews. Useful for setting cadence.
Reminder: Use Gartner and the regression analysis guidance before changing rep-facing incentives or compensation structures tied to scorecard scores. Validate first, then act.