Sales Conversion Rate: Definition, Formula, and How to Improve It
Discover what is sales conversion rate, its formula, and tips to boost it. Transform leads into customers and increase your revenue.
Published: August 2, 2026
Author: OffBook Editorial Team

Sales conversion rate is the percentage of leads that complete a desired action, typically becoming a paying customer. The core formula is straightforward:
Sales Conversion Rate = (Conversions ÷ Leads) × 100
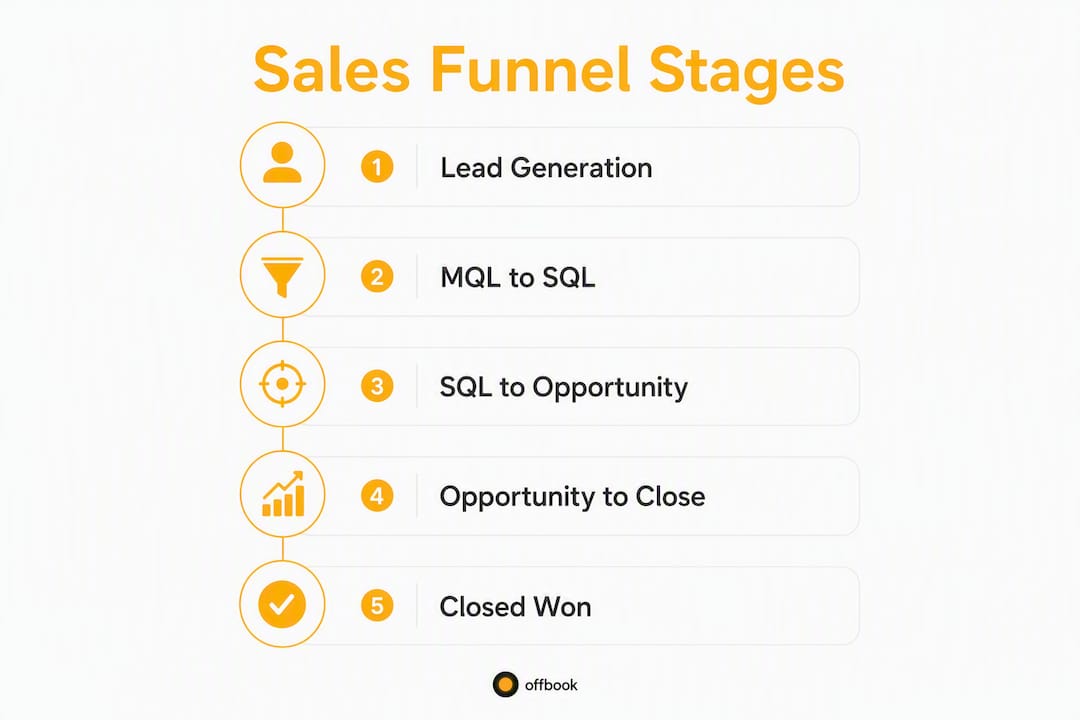
Run 200 demos and close 25 deals: that’s a 12.5% conversion rate. Simple math, but the number only becomes useful when you define what counts as a “conversion” at each stage. In B2B sales, that means tracking transitions: MQL to SQL, SQL to Opportunity, Opportunity to Win. Each stage has its own rate, and each tells a different story about where your pipeline is leaking.
Table of Contents
- What is sales conversion rate, and why does it matter?
- How do you calculate conversion rate at each funnel stage?
- What are realistic conversion rate benchmarks for B2B SaaS?
- How do you measure conversion rate reliably?
- Which metrics should you track alongside conversion rate?
- How do you improve your sales conversion rate?
- What does research say about where conversion gains actually come from?
- Key Takeaways
- The metric that actually runs a sales team
- Real-time coaching closes the gap between knowing and doing
- Useful sources and further reading
What is sales conversion rate, and why does it matter?
Your sales conversion rate is the single clearest signal of how well your sales process turns interest into revenue. A high traffic number with a low conversion rate means your funnel is broken somewhere, and adding more leads just accelerates the problem.

The metric applies at every level of the funnel. Overall conversion rate (all leads to closed-won) gives you the headline number. Stage-based rates tell you where the breakdown is. A rep closing 30% of opportunities but converting only 15% of SQLs to opportunities has a qualification problem, not a closing problem. Those two diagnoses require completely different fixes.
For B2B SaaS teams, the importance of tracking this metric by stage cannot be overstated. Founders and VPs of Sales who look only at the top-line win rate often miss the real bottleneck for months.
How do you calculate conversion rate at each funnel stage?
The primary formula stays the same at every stage. What changes is the numerator and denominator.
- Overall conversion rate: (Total closed-won deals ÷ Total leads entered) × 100
- MQL to SQL rate: (SQLs created ÷ MQLs generated) × 100
- SQL to Opportunity rate: (Opportunities opened ÷ SQLs qualified) × 100
- Opportunity to Win rate: (Deals closed-won ÷ Opportunities entered) × 100
Defining the denominator correctly matters as much as the formula itself. An MQL is a lead that meets your marketing qualification criteria (job title, company size, intent signal). An SQL has been reviewed by sales and confirmed as worth pursuing. An Opportunity has a defined budget, timeline, and decision-maker engaged. If your CRM stages don’t match these definitions consistently, every rate you calculate is measuring something different from what you think.
Time windows add another layer. Monthly snapshots catch seasonal swings. A rolling 90-day window smooths noise and is better for early-stage teams with lower volume. Quarter-to-date works for board reporting. The rule: pick one window per metric and never switch mid-comparison.
| Stage | Numerator | Denominator | What it diagnoses |
|---|---|---|---|
| MQL → SQL | SQLs created | MQLs generated | Lead quality and marketing alignment |
| SQL → Opportunity | Opportunities opened | SQLs qualified | Rep qualification discipline |
| Opportunity → Win | Closed-won deals | Opportunities entered | Closing effectiveness |
| Overall | Closed-won deals | All leads entered | Full-funnel efficiency |
What are realistic conversion rate benchmarks for B2B SaaS?
Benchmarks are useful only when you compare like for like. Conversion rates vary by product category, price point, acquisition channel, and deal complexity, so a raw industry average tells you almost nothing on its own.
Three worked examples:
Example 1 — Overall rate: 500 inbound leads in Q1, 30 closed-won deals. Rate: (30 ÷ 500) × 100 = 6%.
Example 2 — Stage-based: 200 MQLs → 80 SQLs (40% MQL-to-SQL) → 32 Opportunities (40% SQL-to-Opp) → 10 wins (31% Opp-to-Win). Overall: 5%.
Example 3 — Source-segmented: Inbound demo requests convert at 18% to closed-won. Cold outbound converts at 4%. Same product, same team, very different numbers. Mixing them into one average hides which channel is actually working.
| Segment | Typical range | Notes |
|---|---|---|
| B2B SaaS (inbound) | varies significantly | Higher for lower-ACV, self-serve products |
| B2B SaaS (outbound) | varies significantly | Varies sharply by ICP fit and sequence quality |
| E-commerce (general) | varies by performance | Top performers reach multiple times average |
| Enterprise SaaS | varies significantly | Long cycles, multiple stakeholders |
| SMB SaaS (PLG) | varies significantly | Freemium-to-paid conversion included |
The right target for your team comes from your own historical data first, then industry ranges as a sanity check. A $50K ACV enterprise deal converting at 8% is exceptional. A $99/month self-serve product converting at 8% is underperforming.
Pro Tip: Segment your conversion rate by lead source before setting any targets. Blended rates mask your best and worst channels and make it nearly impossible to allocate budget or coaching effort correctly.
How do you measure conversion rate reliably?
Reliable measurement starts with clean CRM stage definitions and consistent attribution. Without both, you’re calculating rates on dirty data.
Measurement checklist:
- Define each CRM stage in writing and share the definitions with every rep
- Capture UTM parameters and lead source fields at the moment of entry, not retroactively
- Use a single canonical lead record per prospect (no duplicates across channels)
- Set a consistent time window for each metric before the reporting period starts
- Audit stage progression monthly: look for leads stuck in a stage for more than 2× your average sales cycle
Tools and where each is authoritative:
Your CRM (Salesforce, HubSpot) is the system of record for stage-based conversion rates. Web analytics (Google Analytics 4) owns top-of-funnel traffic and form submission data. Attribution platforms (Rockerbox, Northbeam) reconcile multi-touch credit across channels. BI dashboards (Looker, Tableau) aggregate everything for executive reporting. The B2B sales tech stack that connects these tools without gaps is what separates teams that trust their numbers from teams that argue about them every Monday.
Reporting cadence by role:
- Reps: weekly, focused on their own stage rates and pipeline velocity
- Sales managers: weekly, comparing rates across reps to spot coaching needs
- VPs of Sales / founders: monthly and quarterly, tracking trends and cohort comparisons
- Board / investors: quarterly, with context on benchmark ranges
Common pitfalls: Double-counting leads when a prospect re-enters the funnel through a different channel. Mismatched time windows (comparing a monthly rate to a quarterly rate). Conversion leakage when a deal closes in a different stage than where it was tracked. Page speed issues on demo sign-up forms also suppress top-of-funnel conversion before a lead ever reaches your CRM.
Which metrics should you track alongside conversion rate?
Conversion rate in isolation can mislead. A rising win rate paired with a shrinking pipeline means you’re getting more selective, not more effective. These companion metrics give the full picture.
Tracking conversion rate without deal size is like measuring your batting average without knowing the score. You need both to understand whether you’re actually winning.
| Metric | What it tells you |
|---|---|
| Win rate | Percentage of opportunities closed-won; conversion rate’s closest cousin |
| Average deal size | Whether you’re winning the right deals, not just more deals |
| CAC | Cost to acquire each customer; rising CAC with flat conversion signals channel inefficiency |
| LTV | Revenue per customer over time; validates whether conversion targets are worth the cost |
| Sales cycle length | How long conversion takes; longer cycles compress quarterly results |
| Lead velocity rate | Month-over-month growth in qualified leads; a leading indicator of future pipeline |
The most useful early warning combination: falling conversion rate plus rising CAC. That pattern almost always points to a lead quality problem upstream, not a sales execution problem. Fix the source before coaching the reps.
How do you improve your sales conversion rate?
Start with the highest-impact, lowest-effort changes. For most B2B SaaS teams, that means fixing qualification before touching anything else.
Prioritized improvement sequence:
- Tighten qualification criteria. Define your ICP precisely and enforce it at the MQL-to-SQL gate. Reps spending time on poor-fit leads is the single biggest conversion killer in early-stage teams.
- Cut speed-to-contact. Response time to inbound demo requests degrades conversion sharply after the first hour. Automate the first touchpoint if you can’t staff it.
- Reduce form friction. Cutting form fields significantly can produce substantial lifts on high-intent pages. Start with your demo request form.
- Improve pre-call research. Reps who walk into a call knowing the prospect’s tech stack, recent funding, and likely pain points ask better questions and handle objections faster.
- Run structured objection handling. Map the five most common objections and build a response framework around each. Inconsistent objection handling is a coaching problem, not a rep problem.
- A/B test one variable at a time. Change the call-to-action copy, the form length, or the follow-up sequence, but never all three simultaneously. Run each experiment for at least 30 days before reading results.
For early-stage startups: Focus on qualification and pre-call prep first. You don’t have enough volume to run statistically meaningful A/B tests, so invest in rep skill before process automation.
For established sales teams: Behavioral analytics and call recording review are your highest-leverage tools. Look for patterns in lost deals: which stage, which objection, which rep.

Pro Tip: Check your mobile-to-desktop conversion ratio. If mobile converts at less than 60% of your desktop rate, fix the mobile form and checkout experience before any other UX change. That gap is almost always recoverable.
What does research say about where conversion gains actually come from?
The evidence points consistently to two levers: removing friction and improving call quality.
Behavioral analytics reveal where prospects drop off in the user journey. Teams that start with friction identification rather than lead volume increases get faster and more durable conversion gains. Adding traffic to a broken funnel just means more people hitting the same wall.
The most reliable conversion improvements come from understanding what stops a qualified prospect from taking the next step, not from finding more prospects.
Call quality is the other major lever. AI-assisted coaching works best when it augments human judgment rather than replacing it, particularly at the executive decision-making level. Live prompts that surface qualification gaps, objection responses, and next-step recommendations during a call give reps the support they need without removing the human relationship that closes enterprise deals.
Behavioral data checklist for conversion experiments:
- Identify the stage with the largest drop-off rate
- Use session recordings or heatmaps to find friction points on key pages
- Review call recordings for the most common objection that precedes a lost deal
- Run one targeted fix per experiment cycle and measure against a control group
- Validate mobile conversion parity before scaling any campaign
Pro Tip: The technology behind sales coaching has moved fast. Live in-call prompts tied to your qualification framework now do what post-call review used to do, but in the moment when it actually changes the outcome.
Key Takeaways
Sales conversion rate is most useful when measured at each funnel stage, benchmarked against like-for-like segments, and paired with deal size and CAC to avoid misleading conclusions.
| Point | Details |
|---|---|
| Core formula | (Conversions ÷ Leads) × 100, applied separately at each funnel stage for meaningful diagnosis. |
| Measurement discipline | Clean CRM stage definitions and UTM capture at entry are prerequisites for trustworthy rates. |
| Benchmark context | B2B SaaS inbound typically runs 5%–8%; always segment by channel and price point before comparing. |
| Top improvement levers | Tighten qualification, cut form fields, improve pre-call research, and fix mobile friction first. |
| Offbook for call quality | Offbook surfaces live in-call prompts tied to MEDDIC/MEDDPICC, improving qualification and objection handling in the moment. |
The metric that actually runs a sales team
Conversion rate is the number I look at before anything else in a weekly pipeline review. Not because it’s the most important metric in isolation, but because it’s the fastest way to locate a problem. A rep with a strong MQL-to-SQL rate and a weak Opportunity-to-Win rate needs closing coaching. A rep with the opposite pattern needs qualification work. The number points you to the right conversation.
The habit that moves the needle most consistently: reviewing stage-based rates by rep, every week, and connecting each gap to a specific coaching action. Not a general “let’s improve conversion” conversation, but a specific “you’re losing 60% of deals at the technical evaluation stage, so let’s look at your discovery questions.” That specificity is what separates teams that improve from teams that just track.
For founders running their own sales, the metrics that matter most are often the stage-based ones, because they reveal whether your sales process is actually working or whether you’re just getting lucky with warm referrals.
Real-time coaching closes the gap between knowing and doing
Understanding your conversion rate tells you where the problem is. Fixing it on a live call is the harder part.
Offbook is built for exactly that moment. It listens to your video calls without joining as a bot, surfaces live on-screen prompts tied to MEDDIC and MEDDPICC, and flags qualification gaps as they happen, not in the post-call debrief when the deal has already stalled. Pre-call briefs give reps the company research and stakeholder context they need to ask better questions from the first minute. The result: more disciplined discovery, faster objection handling, and fewer deals lost to avoidable gaps in qualification.
For seed and Series A B2B SaaS teams where every rep’s call quality directly affects the quarter, Offbook turns conversion rate insights into real-time coaching that changes outcomes while the call is still happening. Start your free trial and see the difference in your next discovery call.
Useful sources and further reading
- HubSpot: Sales Conversion Rate — definition, formula, and stage-based variants
- Salesforce: What Is a Sales Conversion Rate? — CRM hygiene and attribution best practices
- Shopify: Sales Conversion Rate — formula walkthrough and e-commerce benchmarks
- Quantum Metric: 7 Ways to Improve Conversion Rates — behavioral analytics and friction removal
- Scale Growth Digital: How to Increase Conversion Rate — form reduction tactics and mobile benchmarks
- Triple Whale: What Is a Good Conversion Rate? — segmented benchmarking guidance
- Cloudflare: Website Performance and Conversion Rates — page speed impact on top-of-funnel conversion
- Gain.io: Sales Conversion Rate — AI augmentation and call-quality research